


Between consumption rates, waste audits, satisfaction surveys and calorie counts, some days it seems food service can fall into a relentless spiral of quantification. There’s little doubt that our clients are constantly in the pursuit of quality food options and efficient preparations, but the tide of data and subsequent number crunching can prove a distraction for some.
How are those numbers interpreted? How do they figure into decision-making? And what is really being decided on? Does this sound like a familiar refrain?
At Burlodge, we’re always interested in understanding which metrics prove the most
helpful on these assessments (and which aren’t, it should be said). Our discussions with a selection of nutrition managers indicates a desire to find helpful information, provided it is useful to staff and helpful for improved patient service. But there are skeptics, naturally.
Count on Food
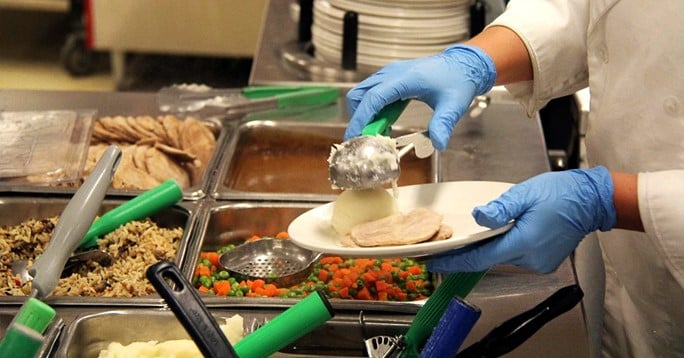
“Food first,” insists one of our clients, who brings it back to the essentials. “We’re trying to focus on consumption rates rather than grams counted,” she says. That means assuming some more leeway that may not toe the line of dietary standards, but never at the expense of patient health. “Patients are getting what they want,” she says, and in the meantime, “We’re going to work with the clinical team to better understand what is being consumed.”
Another manager collaborates with a statistical support team to look at food waste rates. They undertake these assessment activities every three months to look for trends and determine which foods are ripe for dropping from the menu.
Define ‘Waste’
Distinctions need to be made, though, about what qualifies as actual waste. In this case, should the nutritionally neutral cup of tea that is not consumed count as waste in the final assessment? Or should it just come down to what is on the plate for these counts? Count that cup of tea and the actual waste numbers that are reported do not necessarily reflect the most important aspects of consumption and waste rates.
What’s telling about conducting surveys like this is that it can overturn assumptions that are commonly made by staff. As is human nature, gut feelings tend to overrule statistically verifiable information. In this case, for example, the staff’s belief that shepherd’s pie should be cut from the menu proved misguided. As for the tuna casserole, well… not so lucky.
Have similar challenges that you’d care to share with us? Let us know what sort of measurements you find helpful and which ones deserve a more critical eye.